【已解决】使用echarts-convert.js生成图片的时候,怎么动态修改长和宽?
- echarts
- 时间:2023-06-08 00:16
- 4098人已阅读
🔔🔔🔔好消息!好消息!🔔🔔🔔
有需要的朋友👉:联系凯哥
在使用echarts-convertjs生成图片的时候,想要动态的生成图片的大小,怎么设置?
查看echarts-convert.js源码:
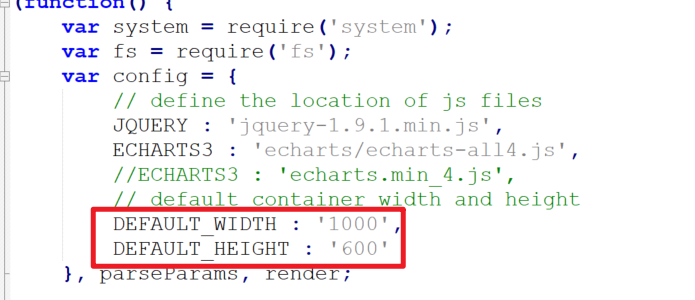
可以看到,在config中设置了默认width和height是1000和600,那么怎么修改呢?
我们查看源码,查看到设置图片大小的是在:createChart这个方法中。而此方法又是被page.open方法调用的。
查看源码,可以看到width和height是从params中获取的。如果没有就使用config中配置的默认值。如下图:

那么,params的值又是从哪里来的呢?继续看源码:
是render方法中的。如下图:

继续跟源码:render方法又是在哪里被调用的呢?
在js的倒数第二行。如下图:

其中的params是调用了parseParams()方法获取的。如下图:

继续跟源码:
parseParams又调用了getParams()方法获取到data.如下图:
查看getParams方法。如下图:
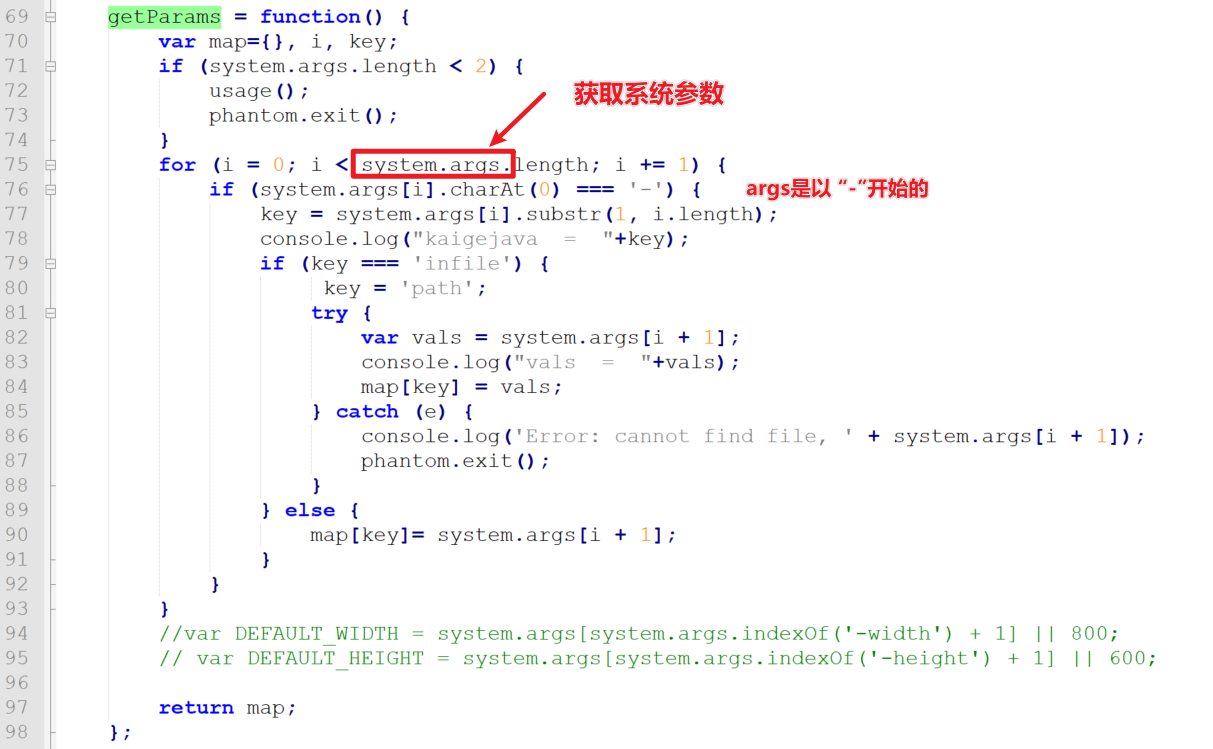
可以发现,原来获取参数是从这里获取到的啊。而且是以“-”开头的。那么宽和高,入参怎么配置呢?
查看echarts-convert.js官方介绍,我们可以看到如下的:
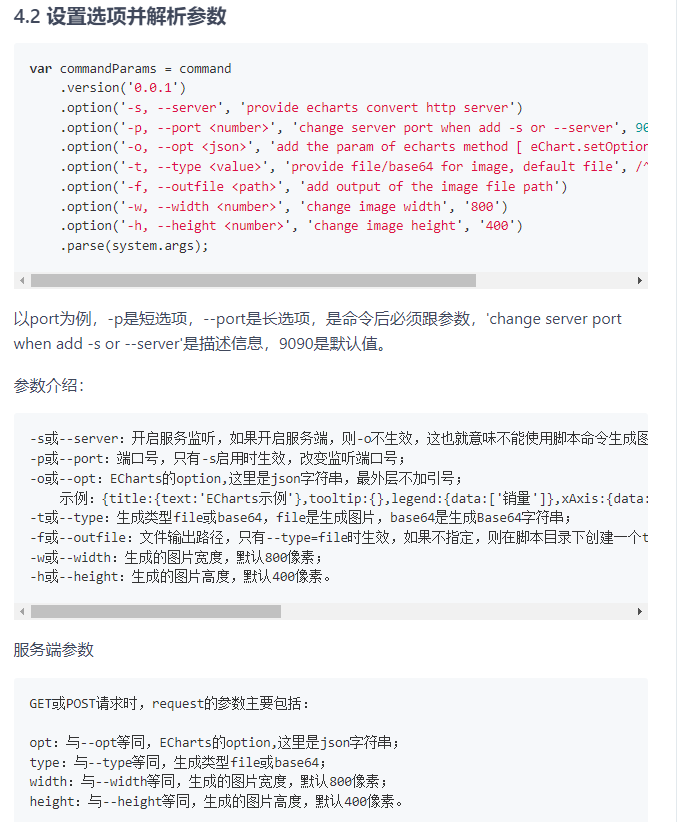
就算不看官方文档,我们都已经知道是以“-”开头的,那么,我们就直接在parseParams方法中进行修改:
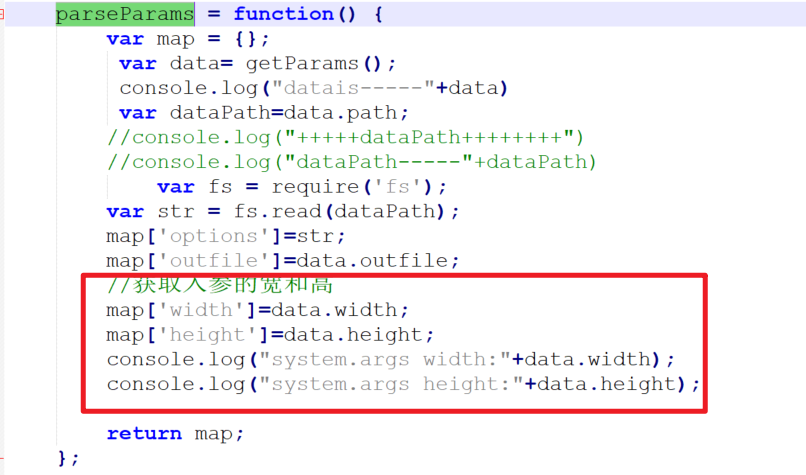
添加如上代码就可以了。
验证:
直接在CMD窗口,输入如下命令即可:
参数格式:
phantomjspath echarts-convvert.jspath -wideth 宽度值 -height 高度值 -infile 输入文件json路径 -outfile 输出png文件路径
参数1:phantomjs的完整路径。凯哥这里使用的是Windows的。所以就是phantomjs.exe的完整路径(包含文件名和后缀)
参数2:echarts-convvert.js的完整路径(包含文件名和后缀)
参数3:需要设置宽度大小
参数4:需要设置的高度大小
-infile 后面跟着的是json的完整路径(包含文件名和后缀)
-outfile 输出png的完整路径(包含文件名和后缀)
D:\files\test\dataReportFile\dataall>D:\files\test\createImagesoftware\phantomjs-2.1.1-windows\bin\phantomjs.exe D:\files\test\createImagesoftware\echarts-convert\echarts-convert1.js -width 1000 -height 400 -infile D:\files\test\dataReportFile\dataall\test.json -outfile D:\files\test\dataReportFile\dataall\test.png
需要注意:-width和-height的值是在convert.js后面跟着。别写错位置了
执行后,js中打印的console.log如下图:

执行命令后,可以看到图片已经被加载了。
查看图片属性,看看宽高大小:
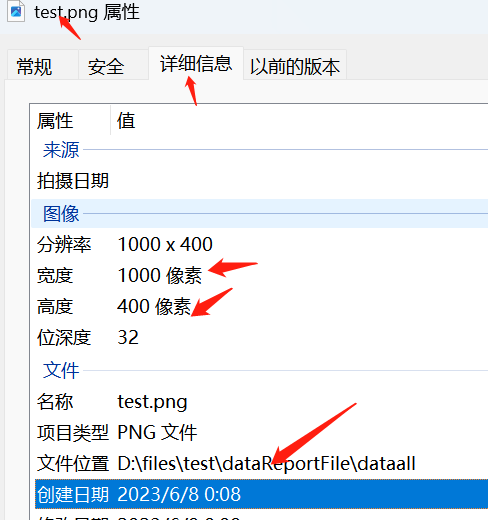
图片的大小就是1000*400。而不是默认的1000*600.这样就可以动态的修改大小了
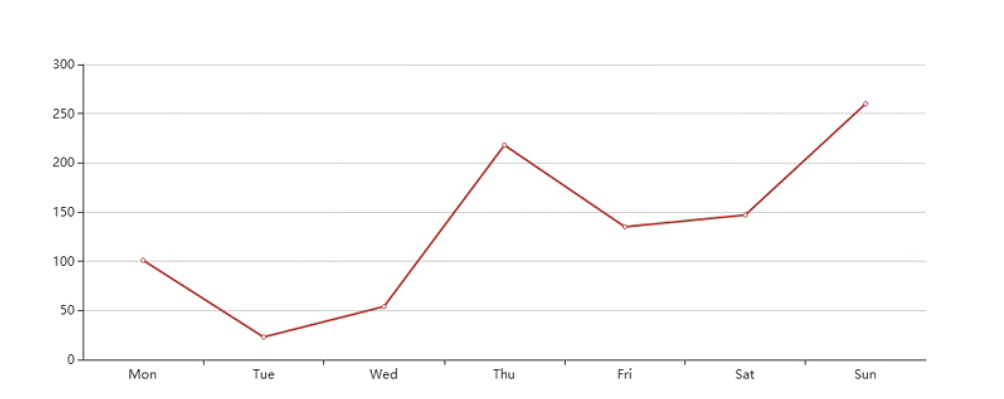
test.json数据如下:
{xAxis:{type:'category',data:['Mon','Tue','Wed','Thu','Fri','Sat','Sun']},yAxis:{type:'value'},series:[{data:[101,23,54,218,135,147,260],type:'line'}]}生成后的图片:
扩展:
echarts-convert.js的源码:
(function() {
    var system = require('system');
    var fs = require('fs');
    var config = {
        // define the location of js files
        JQUERY : 'jquery-1.9.1.min.js',
        ECHARTS3 : 'echarts/echarts-all4.js',
        //ECHARTS3 : 'echarts.min_4.js',
        // default container width and height
        DEFAULT_WIDTH : '1000',
        DEFAULT_HEIGHT : '600'
    }, parseParams, render;

    usage = function() {
        console.log("\nUsage: phantomjs echarts-convert.js -options options -outfile filename -width width -height height"
                        + "OR"
                        + "Usage: phantomjs echarts-convert.js -infile URL -outfile filename -width width -height height\n");
    };

    pick = function() {
        var args = arguments, i, arg, length = args.length;
        for (i = 0; i < length; i += 1) {
            arg = args[i];
            if (arg !== undefined && arg !== null && arg !== 'null' && arg != '0') {
                return arg;
            }
        }
    };
    var base64Pad = '=';
    var toBinaryTable = [-1, -1, -1, -1, -1, -1, -1, -1, -1, -1, -1, -1, -1, -1, -1, -1, -1, -1, -1, -1, -1, -1, -1, -1, -1, -1, -1, -1, -1, -1, -1, -1, -1, -1, -1, -1, -1, -1, -1, -1, -1, -1, -1, 62, -1, -1, -1, 63,
                         52, 53, 54, 55, 56, 57, 58, 59, 60, 61, -1, -1, -1, 0, -1, -1, -1, 0, 1, 2, 3, 4, 5, 6, 7, 8, 9, 10, 11, 12, 13, 14,
                         15, 16, 17, 18, 19, 20, 21, 22, 23, 24, 25, -1, -1, -1, -1, -1, -1, 26, 27, 28, 29, 30, 31, 32, 33, 34, 35, 36, 37, 38, 39, 40,
                         41, 42, 43, 44, 45, 46, 47, 48, 49, 50, 51, -1, -1, -1, -1, -1
                     ];
    base64ToString = function(data) {
    	//console.log("data  = "+data);
        var result = '';
        var leftbits = 0; // number of bits decoded, but yet to be appended
        var leftdata = 0; // bits decoded, but yet to be appended
        // Convert one by one.
        for (var i = 0; i < data.length; i++) {
        	var c = toBinaryTable[data.charCodeAt(i) & 0x7f];
        	//console.log("i  = "+c);
            var padding = (data.charCodeAt(i) == base64Pad.charCodeAt(0));
            // Skip illegal characters and whitespace
            if (c == -1) continue;

            // Collect data into leftdata, update bitcount
            leftdata = (leftdata << 6) | c;
            leftbits += 6;

            // If we have 8 or more bits, append 8 bits to the result
            if (leftbits >= 8) {
                leftbits -= 8;
                // Append if not padding.
                if (!padding)
                    result += String.fromCharCode((leftdata >> leftbits) & 0xff);
                leftdata &= (1 << leftbits) - 1;
            }

        }
        console.log(result);
//        if (leftbits)
//            throw Components.Exception('Corrupted base64 string');

        return result;
    };

    getParams = function() {
        var map={}, i, key;
        if (system.args.length < 2) {
            usage();
            phantom.exit();
        }
        for (i = 0; i < system.args.length; i += 1) {
            if (system.args[i].charAt(0) === '-') {
                key = system.args[i].substr(1, i.length);
				console.log("kaigejava  =  "+key);
                if (key === 'infile') {
                     key = 'path';
                    try {
                    	var vals = system.args[i + 1];
                    	console.log("vals  =  "+vals);
                        map[key] = vals;
                    } catch (e) {
                        console.log('Error: cannot find file, ' + system.args[i + 1]);
                        phantom.exit();
                    }
                } else {
                    map[key]= system.args[i + 1];
                }
            }
        }
		//var DEFAULT_WIDTH = system.args[system.args.indexOf('-width') + 1] || 800;
		// var DEFAULT_HEIGHT = system.args[system.args.indexOf('-height') + 1] || 600;

        return map;
    };
    parseParams = function() {
        var map = {};
         var data= getParams();
		 console.log("datais-----"+data)
         var dataPath=data.path;
        //console.log("+++++dataPath++++++++")
        //console.log("dataPath-----"+dataPath)
            var fs = require('fs');
        var str = fs.read(dataPath);
        map['options']=str;
        map['outfile']=data.outfile;
		//获取入参的宽和高
		map['width']=data.width;
		map['height']=data.height;
		console.log("system.args width:"+data.width);
		console.log("system.args height:"+data.height);

        return map;
    };

    render = function(params) {
        var page = require('webpage').create(), createChart;

        page.onConsoleMessage = function(msg) {
            console.log(msg);
        };

        page.onAlert = function(msg) {
            console.log(msg);
        };

        createChart = function(inputOption, width, height) {
		            console.log("createChart-width:"+width+" .height:"+height);

            var counter = 0;
            function decrementImgCounter() {
                counter -= 1;
                if (counter < 1) {
                    console.log(messages.imagesLoaded);
                }
            }

            function loadScript(varStr, codeStr) {
                var script = $('<script>').attr('type', 'text/javascript');
                script.html('var ' + varStr + ' = ' + codeStr);
                document.getElementsByTagName("head")[0].appendChild(script[0]);
                if (window[varStr] !== undefined) {
                    console.log('Echarts.' + varStr + ' has been parsed');
                }
            }

            function loadImages() {
                var images = $('image'), i, img;
                if (images.length > 0) {
                    counter = images.length;
                    for (i = 0; i < images.length; i += 1) {
                        img = new Image();
                        img.onload = img.onerror = decrementImgCounter;
                        img.src = images[i].getAttribute('href');
                    }
                } else {
                    console.log('The images have been loaded');
                }
            }
            // load opitons
            if (inputOption != 'undefined') {
                // parse the options
                loadScript('options', inputOption);
                // disable the animation
                options.animation = false;
            }

            // we render the image, so we need set background to white.
            $(document.body).css('backgroundColor', 'white');
            var container = $("<div>").appendTo(document.body);
            container.attr('id', 'container');
            container.css({
                width : width,
                height : height
            });

            // render the chart
            var myChart = echarts.init(document.getElementById("container"));
            myChart.setOption(options);
            // load images
            loadImages();
        };

        // parse the params
        page.open("about:blank", function(status) {
            // inject the dependency js
            page.injectJs(config.JQUERY);
            page.injectJs(config.ECHARTS3);

            var width = pick(params.width, config.DEFAULT_WIDTH);
            var height = pick(params.height, config.DEFAULT_HEIGHT);
			console.log("create the chart   width:"+width +" height:"+height)

            // create the chart
            page.evaluate(createChart, params.options, width, height);

            // define the clip-rectangle
            page.clipRect = {
                top : 0,
                left : 0,
                width : width,

                height : height
            };
            // render the image
            page.render(params.outfile);
            //console.log('render complete:' + params.outfile);
            // exit
            phantom.exit();
        });
    };
    // get the args
    var params = parseParams();

    // validate the params
    if (params.options === undefined || params.options.length === 0) {
       // console.log("ERROR: No options or infile found.");
        usage();
        phantom.exit();
    }

    // set the default out file
    if (params.outfile === undefined) {
        var tmpDir = fs.workingDirectory + '/tmp';
        // exists tmpDir and is it writable?
        if (!fs.exists(tmpDir)) {
            try {
                fs.makeDirectory(tmpDir);
            } catch (e) {
               // console.log('ERROR: Cannot make tmp directory');
            }
        }
        params.outfile = tmpDir + "/" + new Date().getTime() + ".png";
    }

    // render the image
    render(params);
}());